
ASA (Average Speed of Answer) is one of the most quoted metrics in contact center reporting. It looks clean, tracks easily, and appears to tell a simple story: how long it takes to get help.
But ASA only measures the clock. It says nothing about why someone’s calling, what they’ve already gone through, or how they feel when the wait ends.
Teams that treat ASA as a north star often chase seconds instead of solving for experience. They measure speed, not trust. They fix queues without fixing friction.
This article unpacks what ASA actually captures, and what it misses entirely. You’ll see when the metric starts misleading, where it’s hiding risk, and how top-performing CX teams use ASA not as a goal, but as a signal for deeper insight.
Key Takeaways
- Average Speed of Answer (ASA) measures how long it takes for a call to be answered after entering the queue, but it ignores factors like IVR fatigue, intent urgency, and customer sentiment.
- ASA becomes misleading when not paired with metrics like First Call Resolution, CSAT, abandonment rates, or call intent, fast answers don’t mean effective service.
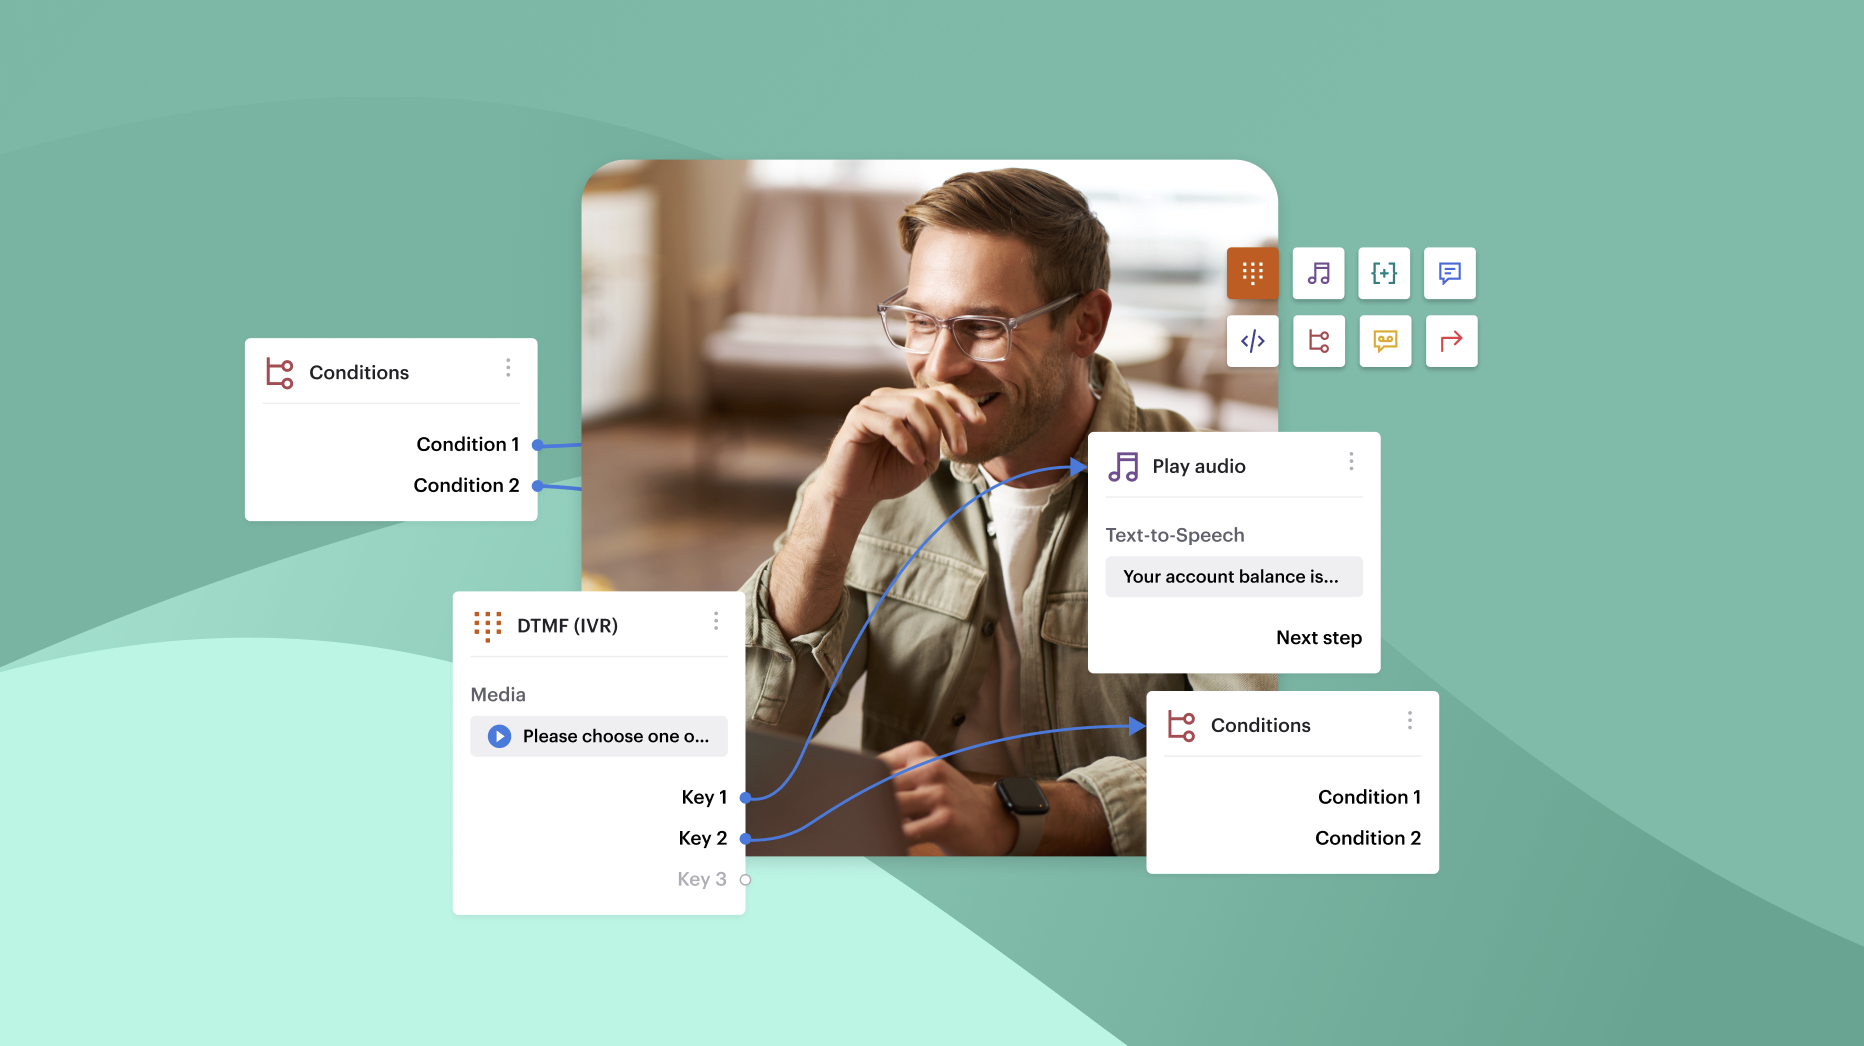
- Voiso’s real-time dashboards turn ASA from a vanity metric into an actionable signal, segmenting by queue, urgency, and outcome to surface what’s actually breaking CX.
- ASA perception varies by context: 30 seconds of silence can feel longer than 60 seconds with clear messaging, which is why customer perception often misaligns with reported ASA.
- Instead of chasing speed, high-performing teams use ASA to diagnose friction points, smart routing, forecasting, and queue transparency reduce both actual and perceived wait times.
What Average Call Answer Time Actually Measures
Average Speed of Answer shows how long callers wait before reaching a live agent. It tracks the time from when someone enters the queue to when their call gets picked up.
Most contact centers use a basic formula:
ASA = Total wait time ÷ Number of answered calls
If 400 calls were answered in a day and customers spent a total of 10,000 seconds waiting, the ASA would be 25 seconds.
Simple math, but it doesn’t tell the full story.
ASA tracks time. It doesn’t track experience.
A 20-second wait feels short, unless the caller’s already gone through three confusing IVR menus. Or listened to two minutes of ringing before reaching the queue. ASA ignores what happened before the queue began.
It also ignores what kind of wait the customer faced. Some queues use silence. Others loop music. Some give clear position estimates. Some don’t say a word. Ten seconds of silence feels longer than thirty seconds of structured hold messaging. ASA sees both the same.
Where ASA starts, and where it misses
ASA begins the moment a customer enters the queue. But not every caller sticks around long enough to get counted. If someone hangs up before reaching an agent, they’re not in the denominator. Their wait time might not get counted either.
That’s why ASA often looks healthier than it really is. High abandonment rates can mask the reality: people are still waiting, but they’re giving up before being counted.
Short calls and misrouted distort the math
Some calls shouldn’t count at all. Accidental dials. Redials that drop immediately. Customers who hang up during IVR transitions. Including them skews the result. ASA drops, but not because service improved.
Even within the queue, not all wait times reflect what matters. A call transferred incorrectly, then quickly answered, may lower ASA while inflating frustration. ASA won’t flag the reroute. It just logs the short delay to the next agent.
Why ASA shouldn’t stand alone
On its own, ASA creates a false sense of control. It only reflects the average time for answered calls. It doesn’t account for call quality, caller intent, queue logic, or repeat attempts. It also can’t differentiate between a delay that frustrates and one that doesn’t.
And when contact centers start chasing ASA as a vanity metric, quality suffers. Calls get answered faster, but routed poorly. Agents get measured on speed—not resolution.
ASA vs. Perceived Wait Time: Why Customers Don’t Feel the Numbers
| Scenario | ASA (Seconds) | Perceived Wait | Why It Feels Longer |
| Clear hold messaging + position given | 45 | ~30 | Expectations set |
| Silent queue, no context | 30 | ~60+ | No sense of progress |
| Long IVR before queue | 25 | ~45 | Friction before wait |
| Callback offered at 60s | 65 | ~10 | Control regained |
ASA is a snapshot. Perception is the story.
Why ASA Fails as a Standalone Metric, and What to Pair It With
ASA looks precise on paper. It delivers a clean number and feels actionable. But used alone, it misleads more than it informs.
Contact centers that chase low ASA without context end up chasing the wrong fixes.
Queue Design Makes or Breaks ASA’s Meaning
ASA measures what happens after someone enters the queue. It ignores what sent them there.
When routing logic is broken, or overloaded, ASA can drop for the wrong reasons. Calls get distributed faster, sure. But they land in the wrong queues, or with agents who can’t help. ASA improves while customer experience quietly unravels.
Segmented routing reveals what raw ASA hides: where the queue fails, not just how fast it moves.
Intent Changes the Value of Every Second
A 60-second wait means something different depending on who’s calling. Someone checking a shipping status might tolerate it. Someone reporting suspected fraud won’t.
ASA without segmentation by call type or customer intent lumps those calls together. That flattens the data, and triggers fixes that don’t match urgency.
Without Other Metrics, ASA Misses What Matters
Fast pickup doesn’t guarantee resolution. ASA without First Call Resolution (FCR) is speed without outcome.
It also misses how wait times affect customer sentiment. Combine ASA with CSAT delta, the satisfaction shift tied to wait time, and you’ll see where patience breaks down. Without it, you might speed up the wrong queues.
And abandonment tells you what ASA leaves out entirely: the people who never made it through. ASA only measures the ones who waited long enough to connect.
ASA Alone vs. ASA in Context
| ASA Value | Paired Metric | Insight Uncovered |
| 22 sec | Abandonment at 18% | Callers aren’t staying long enough to help stats |
| 45 sec | FCR at 92% | Long queue, but problems get solved |
| 30 sec | CSAT -11 after 40 sec | Satisfaction drops before ASA starts hurting |
| 18 sec | Intent: Low-priority | Fast answer, but not where it’s needed |
| 25 sec | SLA Miss at Peak Hours | Looks fine overall—fails exactly when demand spikes |
Numbers don’t lie. But without context, they don’t mean much either.
How Long Is Too Long? (Benchmarks by Industry & Call Type)
Every operations lead wants a target. But benchmarks without context end up doing more damage than good.
Publishing a single ASA threshold for an entire organization invites shortcuts, usually ones that trade speed for quality, or worse, speed in the wrong places.
Intent Dictates Tolerance
Not all calls carry the same emotional weight. Someone checking a flight arrival might be fine waiting 40 seconds. Someone whose account just locked? They want help yesterday.
Different queues have different stakes. Trying to apply one ASA number across all intents hides the queues where every second really matters.
Customer Patience Isn’t Just a Number
There’s a tipping point where a customer moves from “waiting” to “wondering if they’ve been forgotten.” It doesn’t always match the ASA number in your report.
Contact centers that map perceived wait time, what the caller feels, against actual ASA uncover massive gaps. A silent queue might feel twice as long. Music with no updates stretches time too.
That’s why a 25-second ASA with silence leads to higher abandonment than a 40-second ASA with consistent “you’re next” messages. Tolerance isn’t just measured in seconds, it’s emotional.
Suggested ASA Targets by Industry & Call Intent
| Industry | Call Intent | Suggested ASA Target | Why It Matters |
| Financial Services | Fraud / Lockouts | Under 15 sec | Caller feels exposed, delays erode trust fast |
| Financial Services | Loan Queries | Under 30 sec | Some leeway, but speed still impacts conversion |
| Healthcare | Urgent Care Follow-up | Under 20 sec | Caller often anxious, delays increase stress |
| Healthcare | Appointment Booking | Under 40 sec | Lower urgency, info-based, less emotional |
| Retail | Shipping Updates | 30–45 sec | Tolerant audience, but don’t go past 1 minute |
| Retail | Refund Requests | Under 25 sec | Frustrated tone likely, quicker pickup is safer |
| BPO/Support | Password Resets | Under 20 sec | Quick fix expected, long waits feel inefficient |
| BPO/Support | Technical Troubleshooting | 35–50 sec | Complex issues, longer wait okay if routed well |
| Travel & Hospitality | Booking Support | 20–30 sec | Speed ties directly to revenue opportunity |
| Utilities | Outage Reports | Under 20 sec | Time-sensitive, users already frustrated |
ASA only works when it’s grounded in real-world context. A “great” ASA for one queue might be a failure in another.
Where ASA Fails, and Customers Start Dropping
ASA looks clean on a reporting dashboard, but customers never see that number. They feel the wait, not the metric. And that’s where things start to go wrong.
A high ASA doesn’t always signal a problem, if the context is right. Callers waiting 40 seconds for a specialist, with clear messaging and queue confidence, won’t panic. But a 15-second wait with confusing routing, IVR loops, or silent queues? That’s abandonment waiting to happen.
Low ASA Can Still Frustrate
Speed without accuracy is worse than slowness. Routing a customer to the wrong agent in 10 seconds forces them to explain their issue twice. Or three times. Those seconds don’t matter if the experience collapses after connection.
That’s when customers bail mid-call, don’t call again, or leave a scathing review about “getting nowhere fast.”
What Actually Drives Abandonment
ASA only tells one part of the story. Real frustration comes from elements ASA doesn’t catch:
- IVR fatigue: Long menus with irrelevant options.
- Queue ambiguity: No clear signals about where they are or how long they’ll wait.
- False urgency: “Your call is very important to us” repeated while nobody picks up.
- Routing mismatches: Getting transferred after waiting erodes confidence instantly.
These are emotional drop-off points. They don’t show up in ASA reports, but they kill trust faster than any metric can predict.
Strategies That Actually Lower ASA (Without Killing Quality)
Chasing lower ASA without breaking the customer experience takes more than “answer faster.” It starts with knowing where wait time turns into frustration, and which points still feel acceptable to the caller. Most contact centers focus too late in the process. ASA isn’t just an agent metric, it’s a system outcome.
Start with the Queue: Where Do People Drop Off?
Most ASA issues don’t start with agents. They start with queue design. Long, unclear IVRs, hold loops with no updates, or missed context transfers, all of them slow down the actual connection but never show up as technical failures.
Fix the queue first. Track where callers abandon, then map intent to urgency. Booking an appointment? They’ll wait. Suspicious charge on their account? Not a chance.
Count Everything, Even the Callback
Callbacks can game ASA stats if they’re excluded. Some platforms reset the clock when the system dials out. Looks great in the report. Feels awful to the customer who waited 20 minutes just to get a second dial tone.
Track callbacks as part of ASA, or better, create a unified metric for time to first resolution touchpoint, no matter how it connects.
Forecasting Isn’t Planning, It’s Prevention
AI-powered forecasting doesn’t just fill spreadsheets. Done right, it signals volume surges before they hit. That’s where intraday reallocation comes in.
Instead of overstaffing every hour to play it safe, reassign idle agents in real time. If you don’t move the team when the queue shifts, ASA catches up fast, and so does abandonment.
Flex Pools Keep You From Getting Burned
Spikes don’t ask for permission. A product glitch, a billing issue, or just payroll week, any of those can flood your lines without warning.
Having a trained reserve, remote agents on light duty, part-timers logged into monitoring tools, gives you elasticity. You don’t need them every hour. Just the hours that matter
Remove Friction Before the Queue Starts
Smart IVRs don’t bury callers in menus. They solve before routing.
If a customer wants to check a delivery window or update a password, they shouldn’t land in the live queue at all. Those are answerable tasks, not conversations. Taking them out of the queue shortens ASA for everyone else, and lets agents focus on higher-value calls.
ASA in the Bigger Picture, How It Reflects Trust, Not Just Speed
Speed doesn’t win loyalty. Predictability does.
A long average speed of answer doesn’t automatically erode trust, but surprises do. Customers aren’t tracking the seconds; they’re gauging the gap between what they expected and what actually happened. ASA metrics disconnected from that context create false signals. The real question isn’t how fast was the pickup—it’s was the wait explained, acknowledged, and worth it?
Silence Breaks Trust Faster Than Wait Time
No one enjoys waiting, but people can tolerate it, if they know what’s happening. A 40-second hold with regular status updates often feels shorter than a 20-second void. Expectations shape perception. When callers hear nothing or sense they’ve been dropped into a queue black hole, even a short wait feels like neglect.
A fast answer doesn’t repair that kind of damage. In fact, it might make it worse if the conversation starts with confusion instead of clarity.
Speed Without Accuracy Feels Like a Bait-and-Switch
Quick connections don’t count if the call lands in the wrong hands. Transferring to someone who can’t help restarts the emotional clock. Every repeat explanation makes the original wait feel longer and less justified.
Trust breaks when customers feel rushed to the wrong person. ASA isn’t a win if it cuts corners that force callbacks or create friction. Getting it right matters more than shaving off seconds.
Customers Judge ASA Against What They Were Promised
Telling a caller they’ll be connected in under a minute, and making them wait three, does more damage than saying five minutes and delivering in four. Disappointment isn’t about delay; it’s about the mismatch between signal and outcome.
Smart contact centers set ASA targets that reflect not just operational goals, but psychological ones. They focus on wait time certainty, not just reduction. That’s where trust grows, inside the space between promise and delivery.
ASA Is One Signal in a Trust System
Average speed of answer only works as a trust metric when it sits alongside:
- Agent consistency: Are customers talking to someone who knows why they’re calling?
- Queue transparency: Are they told what to expect while they wait?
- Resolution alignment: Are quicker connections actually solving the issue?
ASA isn’t a standalone performance badge. It’s a signal, either that your process respects the caller’s time or that it doesn’t. In either case, they’ll remember.
Real-Time ASA Monitoring with Voiso
Most platforms treat ASA like a rearview mirror, useful for audits, useless for live decisions. Voiso flips that. ASA becomes a real-time signal, monitored, sliced, and acted on while the queue’s still active.
Supervisors don’t just see average wait times by queue, they see them segmented by call intent, agent group, and channel. A surge in wait time for billing? Voiso highlights the spike before abandonment starts. A sudden drop in speed for high-priority cases? You’ll know exactly who’s stuck and why.
Dashboards That Surface What Actually Needs Attention
Voiso’s visual real-time dashboards track more than just answer time. They pair ASA with abandonment rates, callback activity, and queue depth, all side by side. You won’t miss the moment your IVR deflection stops working. You won’t wonder why callbacks jump after a staffing change.
ASA doesn’t live in isolation. Voiso shows how it shifts when channel mix changes, when scripts run long, or when agents get reallocated. That full picture makes ASA actionable, not just another metric to chase.
ASA as an Operational Trigger, Not a Postmortem
Most teams only review ASA after the damage done. Voiso turns it into a real-time operational lever. When answer speed dips below thresholds for a specific intent or region, Voiso can automatically fire alerts, or redirect calls before churn risks stack up.
Managers stop reacting and start reallocating before the queue breaks. ASA becomes part of the system, not just a symptom.
Smarter Routing Backed by Live ASA + AI Forecasting
Voiso doesn’t stop at showing ASA, it uses it. Combined with AI forecasting, ASA trends help trigger routing shifts mid-day. Maybe it’s pulling in an overflow pool. Maybe it’s changing IVR logic to reduce entry friction. Either way, ASA stops being a lagging indicator, and becomes a proactive tool.
When call centers stop guessing and start measuring ASA in real time, retention improves fast. Especially when callers feel the difference before the dashboard even refreshes.
Conclusion: Don’t Chase Seconds, Chase Signal
ASA doesn’t win loyalty on its own. No caller remembers whether it took 21 or 26 seconds. What they remember is how clearly their intent was handled, and how confidently the system met them.
Speed alone means nothing without context. Great CX teams don’t celebrate low ASA. They investigate the reason behind the number. Did that speed come from smart routing, or deflection that dodged accountability? Was the short wait real, or just reclassified through IVR juggling?
Treat ASA like a symptom. When it spikes, something changes, volume, mix, routing logic, or even trust. Use it to start conversations, not end them.
Because when ASA becomes a signal for intent friction, not just queue lag, that’s when it starts making you money. Not just metrics.
Further Reading