Call Center Dashboard Software
Track high-impact metrics with ease
Watch customer interactions unfold in real time across 60+ performance metrics. Use our ready-made templates or build your own customer dashboard.
Your data, on demand
Monitor agent performance
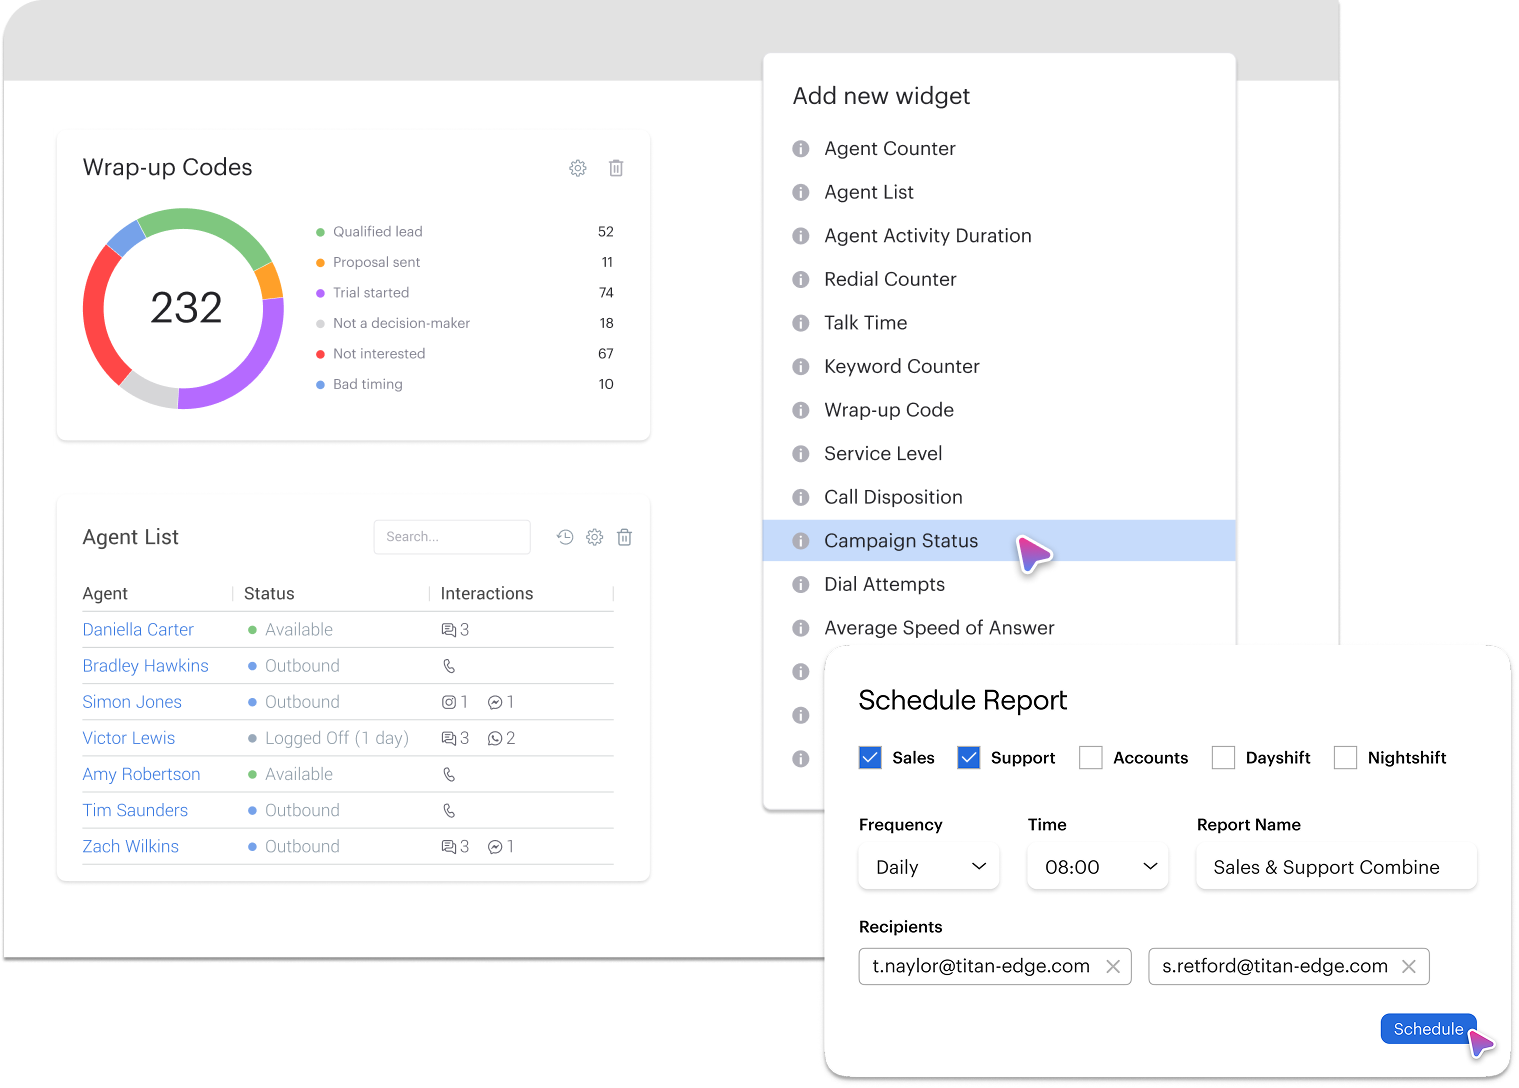
Monitor agent performance in real time with the Agent List widget.
Track call duration, hold time, and live status for targeted coaching.
Use Agent Zoom for deeper analysis and customize dashboards with 20+ metrics.
Effortless customization
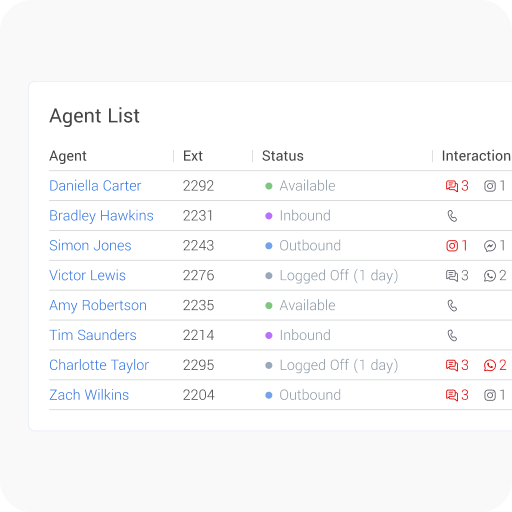
Create custom dashboards for unique teams and priorities.
Arrange and configure widgets to highlight key metrics.
Use color-coded alerts and filters for quick, data-driven decisions.
Extensive widget selection
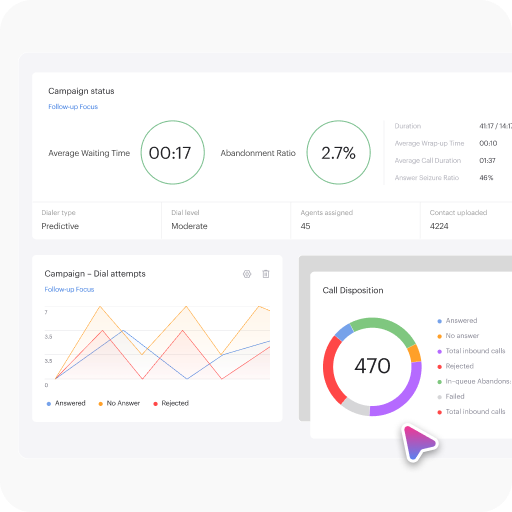
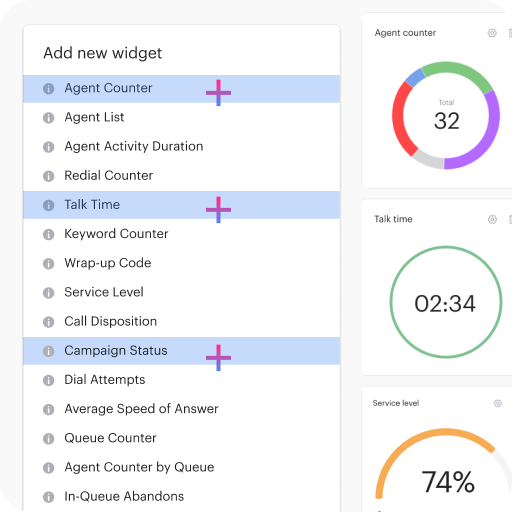
Upgrade dashboards with 60+ ready-to-use widgets.
Track agent performance, call analytics, and queue metrics in real time.
Quickly add widgets for a complete call center overview — no manual reporting needed.
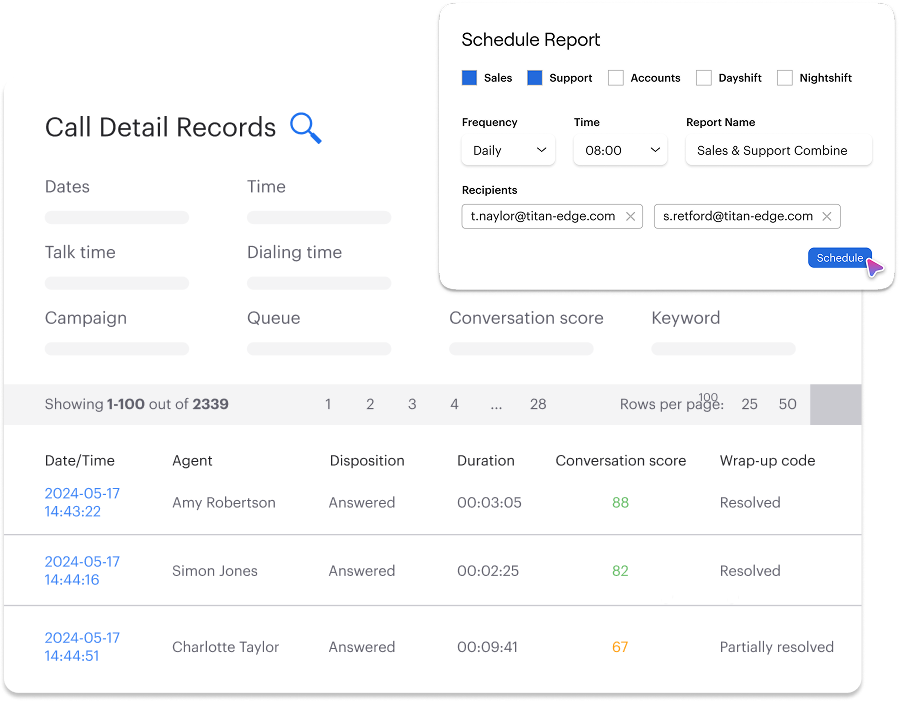
Data-driven insights
customers

Get started in less than 24 hours
FAQ
What is a Call Center Reporting Dashboard?
A Call Center Dashboard, also known as a Real-Time or Live Dashboard, is a visual command center that provides an up-to-the-minute snapshot of your contact center’s performance. It consolidates key metrics and agent activity into a single, easy-to-understand interface, allowing you to monitor call volume, wait times, agent performance, customer satisfaction, and more – all at a glance.
How do Call Center Reporting Dashboards work?
Call Center Dashboards extract data from customer interactions and display it in charts, graphs and other visuals. Many dashboards offer customization options, allowing you to control and adjust the way your data is displayed. You can select which KPI widgets to include in your Dashboard and organize them how you see fit.
What are the benefits of a Call Center Dashboard?
Call Center reporting Dashboards offesr a multitude of benefits, including:
- Improved Agent Performance: By monitoring key metrics like average handle time and call resolution rates, you can identify areas where agents need coaching and support. Dashboards can also motivate agents by showcasing their individual and team performance.
- Enhanced Customer Satisfaction: Real-time insights into wait times and call volume allow you to proactively address potential issues and ensure customers are being served efficiently.
- Data-Driven Decision Making: Call center metrics dashboard provides valuable historical data that can be used to identify trends, optimize staffing levels, and make informed decisions about your contact center operations.
- Increased Operational Efficiency: Call center agent performance dashboard lets you identify bottlenecks and areas for improvement, in return, you can streamline processes and maximize the productivity of your agents.
What are KPIs for call center?
Call Center KPIs, or key performance indicators always include First Call Resolution (FCR), which tracks the percentage of issues resolved on the first contact, and Average Handle Time (AHT), which measures the time agents spend on each interaction. Other vital KPIs include Customer Satisfaction Score (CSAT), Net Promoter Score (NPS), and Service Level, which gauges the percentage of calls answered within a target time. By tracking and analyzing these KPIs through advanced dashboards like Voiso’s, call centers can optimize operations, empower agents, and deliver exceptional customer experiences consistently.
How to monitor call center performance?
Call center performance is monitored using key metrics such as Agent Utilization Rate, which tracks the percentage of time agents spend actively handling calls, and Occupancy Rate, which measures how efficiently agents are working. Other essential metrics include Average Speed of Answer (ASA), indicating how quickly calls are answered, and Average Handle Time (AHT), which measures the duration of customer interactions. By analyzing these metrics, managers can identify areas for improvement and ensure high service quality.
How do I monitor call quality?
To monitor call quality, establish a quality assurance (QA) team comprising managers, supervisors, and experienced agents who understand your customer service standards. This team reviews interactions for adherence to scripts, tone, and resolution efficiency. Utilize tools like call recording and real-time monitoring to evaluate calls, provide feedback, and ensure consistent service delivery.
How many calls should be monitored in a call center?
Monitoring 1–3% of total calls is a common practice to maintain quality, ensure compliance, and mitigate risks. However, increasing the sample size for high-priority campaigns or new agents can provide deeper insights and enhance performance optimization. Balancing efficiency and thoroughness is key.
How do I rate a call center agent?
Call center agents are typically rated based on key performance indicators (KPIs) such as Average Handle Time (AHT), First Call Resolution (FCR), Customer Satisfaction (CSAT) scores, and Call Quality Scores. Combining these metrics with qualitative feedback from call monitoring and customer reviews provides a comprehensive evaluation of agent performance.

